Supported figure types
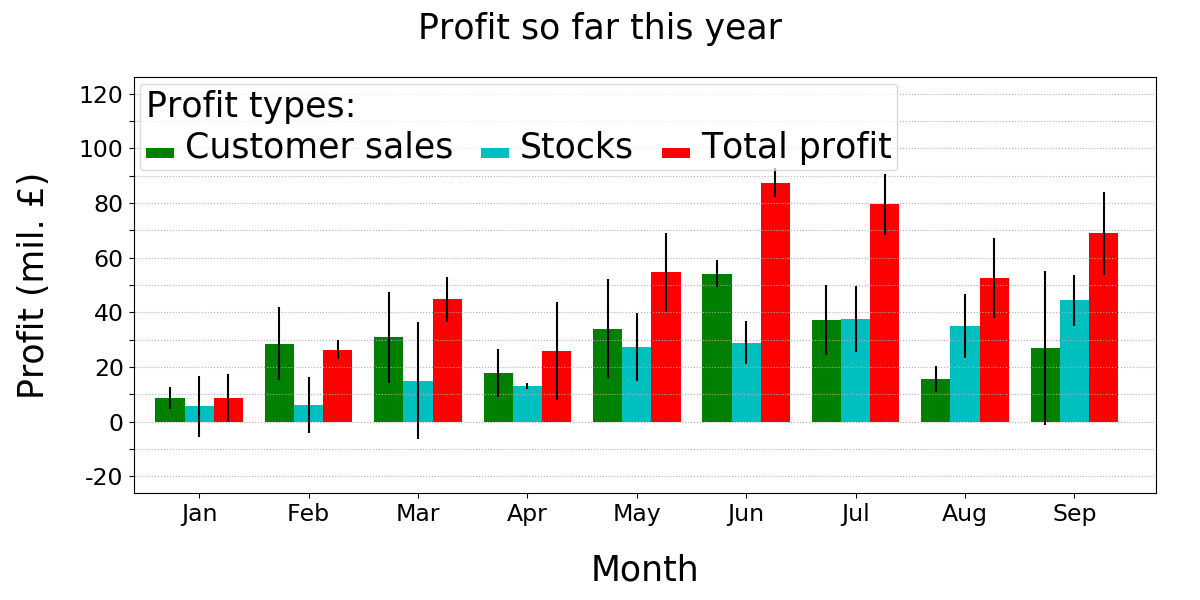
Bar plots
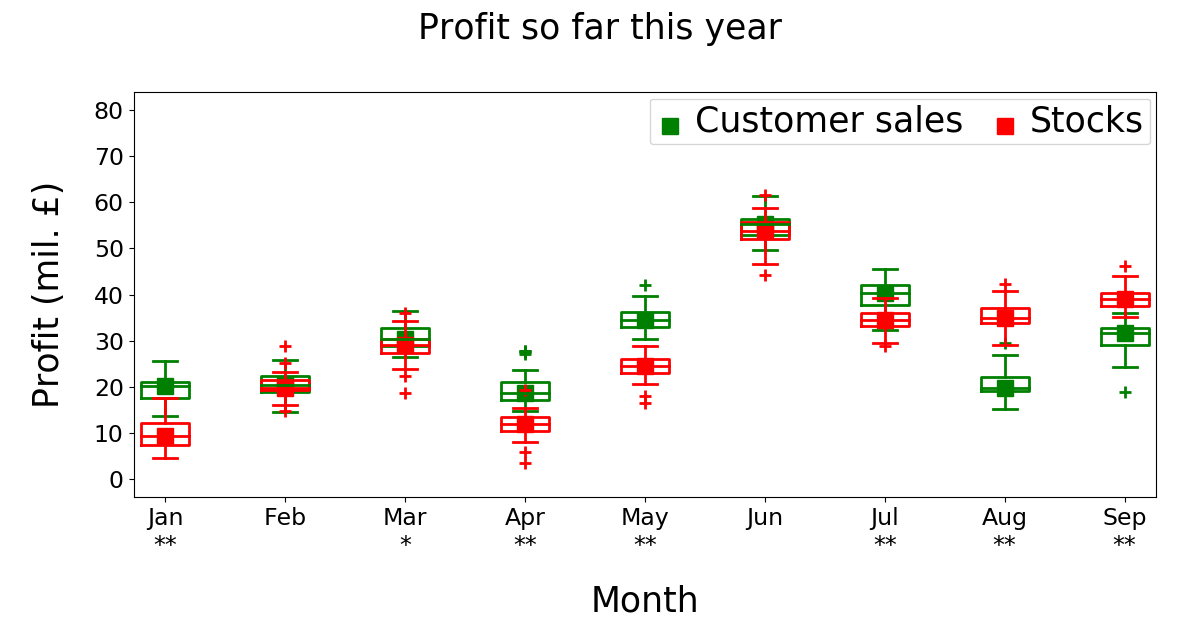
Box plots
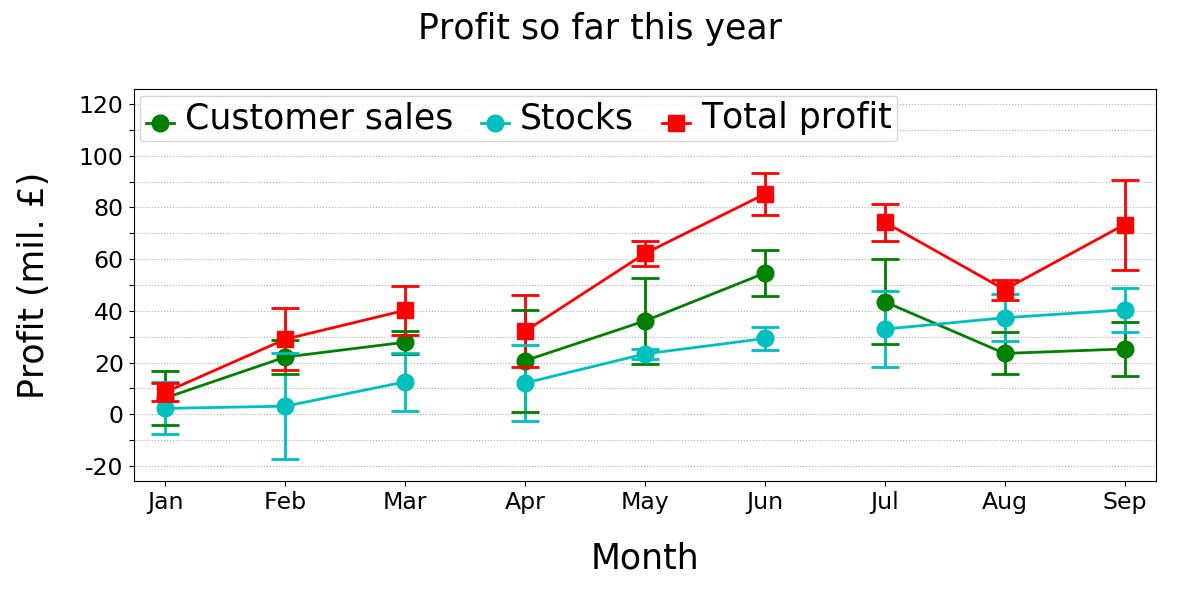
Line plots
Matrix plots

Function pyCreeper.crGraphs.createMatrixPlot()
Code examples:
examples.matrixPlots.example1_simple()
examples.matrixPlots.example2_customAnnotations()